At ACMG 2025, Dr. Moez Dawood announced a groundbreaking initiative: the global democratization of deidentified allele count and frequency data from the first ~250,000 short-read Whole Genome Sequencing (WGS) samples from the All of Us Research Program via an OpenCRAVAT annotator. OpenCRAVAT is proud to incorporate this invaluable resource. The All of Us Research Program is a landmark effort to build one of history’s largest and most diverse health databases. By making this extensive WGS data available, researchers and clinicians gain unprecedented access to population-specific variant frequencies, significantly enhancing the accuracy and reliability of genetic interpretations.
Moez Dawood highlighted the importance of this dataset in his talk, “GREGoR: Accelerating Genomics for Rare Diseases,” during Platform Session 8: Genomic Medicine and Education at ACMG 2025. This presentation underscored the potential of this data to accelerate research and improve clinical care, particularly for rare diseases. We collaborated with Moez to develop an All of Us Annotator.
OpenCRAVAT is excited to announce the integration of this All of Us dataset, providing our users access to this critical information within our powerful annotation platform. By leveraging this data, OpenCRAVAT users can:
- Enhance variant prioritization by incorporating population-specific allele frequencies.
- Improve the interpretation of rare variants by comparing them against a large, diverse cohort.
- Streamline clinical workflows with comprehensive and accurate variant annotation.
Watch for the upcoming preprint, which will provide further details about this exciting project.

As a part of our ongoing effort to update our variant effect predictors with calibration for ACMG/AMP classifications, we have updated the Variant Effect Predictors section of our Single Variant Page. We have simplified the display of the effect predictors to make them easier to interpret. The raw score of the effect predictor is displayed, but rather than the hard to interpret and sometime unclear predictions of the individual effect predictors, we will display the calibrated BP4 Benignity and the PP4 Pathogenicity classifications.
Additionally, we have removed the circle graph that summarized the predictions. That graph relied on a relatively subjective grouping based on the text of the predictions of individual Effect Predictors. Further, it promoted a search for consensus among Variant Effect Predictors without accounting for correlation among the annotators. We are in the process of designing a view to show the correlation among the calibrated Effect Predictors to help users better evaluate the similarities and differences among Effect Predictors.
We will continue adding Variant Effect Predictors as we complete the calibrations for them. Read more about our efforts to incorporate Calibrated Variant Effect Predictors into OpenCRAVAT.
On the final day of OpenCRAVAT’s Adventurer’s Guide, we celebrate you—our community. OpenCRAVAT thrives because of the passion, creativity, and expertise of its users, developers, and collaborators. Let’s explore how our community is shaping the future of variant annotation.
A Collaborative Network
The success of OpenCRAVAT is rooted in its open, collaborative ecosystem. We welcome contributions from bioinformaticians, clinicians, and researchers alike. Here are just a few ways our community drives innovation:
- Developing New Modules: Contributors from around the globe create specialized annotation tools and predictors that enrich the platform’s functionality.
- Testing and Feedback: Early adopters and experienced users help refine features by sharing insights, reporting bugs, and suggesting improvements.
- Knowledge Sharing: Our community forum and GitHub discussions foster an environment where ideas and best practices are shared freely.
Celebrating Community Achievements
This year, OpenCRAVAT saw incredible milestones thanks to its community:
- User-Developed Modules: New tools were added to the OpenCRAVAT store, addressing challenges like population-specific allele frequencies.
- Educational Initiatives: Our OpenCRAVAT team hosted workshops and webinars, empowering new users to get started with variant annotation.
- Collaborative Partnerships: Joint efforts with CIViC and other organizations have expanded OpenCRAVAT’s reach and capabilities.
How to Get Involved
We’re always looking for new voices and perspectives. Here’s how you can join the adventure:
- Join Discussions: Share your expertise or ask questions on our GitHub discussions page.
- Develop an Annotator: Create and share a custom tool to address specific annotation needs. Explore our developer documentation to get started.
- Share Your Story: Have you used OpenCRAVAT in your work? Tell us about it and we might feature your story in a future blog post!
Looking Ahead
As we move into 2025, we’re excited to grow this vibrant community. Look for upcoming events, new features, and expanded opportunities for collaboration. Together, we can advance the field of genomic variant analysis and make a lasting impact.
On the 11th day of OpenCRAVAT, we’re diving into a standout feature: widgets. Widgets transform data into interactive visualizations and tables, giving you the flexibility to explore your results like never before.
Why Widgets Matter
Widgets provide a dynamic, user-friendly way to interpret variant annotation data. Whether you’re a clinician seeking a clear view of pathogenicity predictions or a researcher investigating population allele frequencies, widgets can adapt to suit your needs.
Widgets in Action
- Interactive Graphs: Visualize trends and patterns across datasets with bar charts, scatter plots, and more. These graphs are perfect for high-level overviews and identifying outliers.
- Detailed Tables: Dive deep into individual annotations with sortable and filterable columns. Tables make it easy to focus on the specific information you need for reporting or further analysis.
- Specialized Widgets: Use tools tailored for specific data types, like conservation scores, protein domain impacts, or ACMG/AMP strength mappings for predictors.
Customize Your Analysis
The real power of widgets lies in customization. In OpenCRAVAT’s interface, you can:
- Select Your Widgets: Choose only the widgets you need for your analysis, decluttering your workspace.
- Reorganize: Rearrange widgets for a layout that suits your workflow.
- Save Preferences: Save configurations to streamline future analyses.
Have ideas for a widget? Join our community discussions to share your thoughts!
Documentation: Installing Widgets & Widget Tutorial
As we approach the end of our 12 Days of OpenCRAVAT, let’s dive into how the OpenCRAVAT API can revolutionize your genomic workflows. The API offers a programmatic way to submit jobs, monitor progress, and generate reports—ideal for users looking to automate variant analysis.
With the API, you can:
- Submit input files directly for annotation.
- Monitor job statuses in real-time to stay updated.
- Request reports in various formats (e.g., TXT, Excel, VCF).
- Perform single-variant annotations instantly.
Whether you’re integrating OpenCRAVAT into a pipeline or scaling your research with automation, the API opens a world of possibilities.
Learn how to get started and explore example scripts:
👉 API Documentation
Cloud computing has transformed genomic variant analysis by enabling scalable and accessible workflows. With OpenCRAVAT, you can run your analyses seamlessly on the cloud, eliminating hardware constraints and making complex computations faster and more efficient. Whether you’re processing a single variant or large-scale datasets, the cloud-based option ensures flexibility and reliability.
Running OpenCRAVAT on the cloud offers significant advantages. First, you save local resources—no need to upgrade your computer’s hardware to handle intensive analyses. Second, cloud environments are optimized for scalability, allowing you to process datasets with thousands of variants efficiently. Finally, cloud platforms support team collaboration, making it easier to share data, annotations, and results with colleagues across the globe.
Getting started is simple thanks to our collaborators at Microsoft Genomics. Set up OpenCRAVAT on Microsoft Azure, and upload your input data. You can leverage cloud-based storage for large files and take advantage of parallel processing to speed up your workflow. Explore how the cloud can elevate your genomic research today!
Computational methods for predicting the effects of genetic variants are used by clinicians for interpreting genetic test results and by researchers for scientific exploration. However, their utility is limited by several issues. First, hundreds of methods are available without clear standards for selection. Additionally, discrepancies among methods regarding the impact of specific variants; challenges in interpreting numerical or categorical predictions (“deleterious”, “pathogenic”, “likely pathogenic” etc.); and the details about the data and logic used for predictions aren’t clear, making it hard to understand results. Furthermore, popular “meta-predictors” designed to combine results from many prediction tools and new AI-based methods have made these transparency and interpretability issues even worse. Users of meta-predictors often don’t know which core predictors matter the most, or how the core predictors redundantly utilize the same features. AI-based predictions hide their processing, taking raw data through a black box and producing outputs without explanation.
This year OpenCRAVAT and CIViC will collaborate in a joint effort to address these issues. As a first step, we will be disseminating pioneering work led by Drs. Vikas Pejaver, Pedja Radivojac, and Steven Brenner, to calibrate the scores of variant effect predictors to strengths of evidence within the ACMG/AMP framework for clinical variant classification. A detailed description of the calibration algorithm can be found in Pejaver et al. 2022.
Clinical geneticists are tasked with interpreting inherited variants identified in genetic testing. This is done with protocols set by professional organizations such as the American College of Medical Genetics (ACMG), the Association for Molecular Pathology (AMP) and others. The ACMG/AMP protocol published in Richards et al. in 2018 classifies variants as Pathogenic or Benign, according to a series of criteria that include molecular properties, family history, population frequencies, functional assays, and computational variant effect predictors, which are the topic of this blog. Each criteria is assessed by rules that measure its “strength of evidence”. In the 2018 guidelines, computational variant effect predictors were not given much weight, because of concerns about their accuracy, interpretability, and transparency. Guidelines for usage of computational tools suggested looking for consensus among multiple variant effect predictors. Many of us disagree with this approach, and we have worked to address these concerns and provide updated recommendations. The work presented in Pejaver et al. AJHG 2022 centers on two criteria known as “BP4” and “PP4”.
The criteria BP4 and PP3 for computational variant effect predictors are included in the RIchards classification framework as supporting criteria for benignity and pathogenicity, respectively:


Table 4 in Pejaver et al. summarizes recommendations for changes in these criteria:

Pejaver et al. suggest that to map variant effect predictor scores onto ACMG/AMP evidence strengths for PP3 and BP4, the first step is to transform the raw scores from a predictor into posterior probabilities of pathogenicity or benignity. The next step is to transform posterior probabilities into positive likelihood ratios, which are more intuitively understood. Finally, raw scores from a variant predictor can be mapped onto posterior probabilities of pathogenicity or benignity. All mathematical details are provided in Pejaver et al.
Over the first half of 2025, we hope to make these mappings for all variant effect predictors easily available in the OpenCRAVAT store and to disseminate them on CIViC. You can find the following calibrated variant effect predictors in the OpenCRAVAT store as of 12/9/2024. The store is available both through run.opencravat.org and your local installation of OpenCRAVAT. More calibrated variant effect predictors will be coming soon!
| Predictor Name | Methodology | Citation |
| BayesDel | Meta-score to assess deleteriousness | Feng, Bing-Jian. “PERCH: A Unified Framework for Disease Gene Prioritization.” Human mutation vol. 38,3 (2017): 243-251. |
| CADD | convolutional neural network | Rentzsch P, Witten D, Cooper GM, Shendure J, Kircher M. CADD: predicting the deleteriousness of variants throughout the human genome. Nucleic Acids Res.2018 Oct 29. |
| CADD exome | convolutional neural network | Rentzsch P, Witten D, Cooper GM, Shendure J, Kircher M. CADD: predicting the deleteriousness of variants throughout the human genome. Nucleic Acids Res.2018 Oct 29. |
| FATHMM | Hidden Markov models | Shihab, H. A., Gough, J., Mort, M., Cooper, D. N., Day, I. N., & Gaunt, T. R. (2014). Ranking non-synonymous single nucleotide polymorphisms based on disease concepts. Human genomics, 8(1), 11. |
| GERP++ | Nucleotide conservation | Davydov, E. V., Goode, D. L., Sirota, M., Cooper, G. M., Sidow, A., & Batzoglou, S. (2010). Identifying a high fraction of the human genome to be under selective constraint using GERP++. PLoS computational biology, 6(12), |
| PHYLOP | Nucleotide conservation | Pollard, K. S., Hubisz, M. J., Rosenbloom, K. R., & Siepel, A. (2010). Detection of nonneutral substitution rates on mammalian phylogenies. Genome research, 20(1), 110-121. |
| REVEL | Meta-predictor, Random Forest | Ioannidis, N. M., Rothstein, J. H., Pejaver, V., et al. (2016). REVEL: an ensemble method for predicting the pathogenicity of rare missense variants. The American Journal of Human Genetics, 99(4), 877-885. |
| SIFT | Multiple sequence alignment | Vaser R, Adusumalli S, Leng SN, Sikic M, Ng PC (2016) SIFT missense predictions for genomes. Nat Protocols 11: 1-9. |
| VEST4 | Random forest | Carter H, Douville C, Stenson PD, Cooper DN, Karchin R. Identifying Mendelian disease genes with the variant effect scoring tool. BMC Genomics. 2013;14 Suppl 3(Suppl 3):S3. |
| PrimateAI | Deep residual neural network | Sundaram, L., Gao, H., Padigepati, S.R. et al. Predicting the clinical impact of human mutation with deep neural networks. Nat Genet 50, 1161–1170 (2018). |
When you run an annotation job with a calibrated variant effect predictor, you will see two new columns: ACMG/AMP Benign (BP4) and ACMG/AMP Pathogenic (PP3).
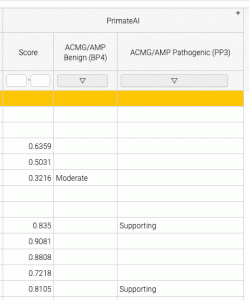
The mapping to clinical evidence strength may be different from the threshold for pathogenicity (or deleteriousness, damage etc) For example, in the results shown below, the PrimateAI raw score of 0.835 is above the recommended threshold for a damaging variant, but with respect to ACMG/AMP clinical Pathogenicity, the evidence that the variant is pathogenic is only “supporting” (vs. very strong, strong, or moderate).
BP4 and PP3 strength of evidence can also be visualized in the widget for each variant effect predictor, such as this one for REVEL.

Please let us know your thoughts and experience with this new feature at https://github.com/KarchinLab/open-cravat/discussions or by emailing us at support@opencravat.org
Efficient data filtering is critical to making sense of your analysis. OpenCRAVAT offers eight customizable filtering options to help you zero in on meaningful results:
- Filter by gene names to focus on specific targets.
- Narrow by variant type (e.g., missense or frameshift).
- Set thresholds for pathogenicity scores like REVEL or CADD.
- Use population frequency filters to flag rare variants.
- Exclude variants found in controls using dbSNP.
- Prioritize by conservation scores such as PhyloP.
- Explore gene-disease associations for relevance.
- Apply cross-database filters to ensure robust findings.
Take advantage of these tools to make your data more actionable.
👉 Learn more about filtering options
OpenCRAVAT is designed with flexibility in mind, offering users the ability to tailor their genomic variant analyses to specific research needs. Whether you’re working with rare disease variants, population studies, or cancer genomics, customization ensures that you focus on the most relevant data. Start by selecting specific annotations from OpenCRAVAT’s extensive module library, including tools like REVEL for pathogenicity predictions or COSMIC for cancer mutations. These modules allow you to target insights that matter most to your research goals.
Customizing your workflow goes beyond choosing modules. OpenCRAVAT empowers users with advanced filtering options to narrow results to specific genes, regions, or variant types. You can also convert your input formats effortlessly—whether you’re starting with VCF, HGVS, or dbSNP IDs—and export results in formats like TXT, Excel, or SQLite for downstream analysis. Additionally, OpenCRAVAT enables you to tailor visualizations, ensuring you present your findings clearly and effectively to collaborators or in publications.
For users looking to optimize performance or scale, OpenCRAVAT offers flexibility in execution. Analyses can be run locally for speed or on the cloud for large-scale datasets. Python-savvy users can even automate workflows with custom scripts, enhancing efficiency. Whether you’re exploring a single variant or working on a cohort study, OpenCRAVAT’s customizable features streamline your journey from data to discovery. Start exploring these tools today and elevate your analysis!
On the sixth day of OpenCRAVAT, we’re highlighting six essential tools that transform your genomic data into actionable insights. These tools are designed to help researchers evaluate the functional impact of genetic variants with precision and reliability.
1️⃣ CHASMplus: Pinpoint cancer driver mutations with this powerful tool, specifically designed to differentiate between drivers and passengers in tumor development. It’s an invaluable asset for cancer researchers. Learn more about CHASMplus here.
2️⃣ REVEL: This tool predicts the pathogenicity of rare missense variants by integrating multiple scores into a single, comprehensive metric. Perfect for clinical researchers and diagnosticians. Explore REVEL here.
3️⃣ PolyPhen-2: Assess the structural and functional impacts of amino acid changes caused by missense mutations. This tool helps you identify damaging mutations quickly and effectively. Discover PolyPhen-2.
4️⃣ gnomAD: Understand population-level variant frequencies with data from the Genome Aggregation Database. This resource is key for identifying rare variants. Visit gnomAD.
5️⃣ ClinVar: Access clinical classifications for your variants with links to supporting evidence. ClinVar is a cornerstone of clinical variant interpretation. Search ClinVar.
6️⃣ COSMIC: Investigate somatic mutations in cancer with data from the Catalogue of Somatic Mutations in Cancer. Explore COSMIC.
Each of these tools is seamlessly integrated into OpenCRAVAT, giving you access to cutting-edge resources without the need to juggle multiple platforms. Whether you’re researching cancer, rare diseases, or population genetics, these tools can provide critical insights.
Ready to explore these powerful tools in your own analysis?
👉 Start with OpenCRAVAT
It’s Day 5 of the 12 Days of OpenCRAVAT, and today we’re sharing five essential tips to help you make the most of your OpenCRAVAT experience. Whether you’re new to the platform or looking to streamline your workflow, these tips will set you on the path to success.
- Create an OpenCRAVAT account on the web: Registering an account allows you to save your projects, access advanced tools, and manage your analysis more effectively. Plus, it opens up additional features like cloud-based processing and result storage.
- Keep OpenCRAVAT up to date: Regular updates ensure you have the latest features, annotations, and improvements.
- Convert your input format: OpenCRAVAT supports various input formats such as VCF, HGVS, and dbSNP. Use the input converters to easily prepare your data for annotation, no matter what format you’re starting with.
But that’s not all! Two more tips are essential for efficient interpretation and analysis:
- Filter your results: OpenCRAVAT’s advanced filtering tools help you zero in on variants of interest, whether by pathogenicity, frequency, or other criteria. Tailor your output to ensure you’re only working with the most relevant data.
- Visualize your results: Don’t just analyze—visualize! With OpenCRAVAT’s interactive viewer, you can explore annotations in a dynamic format, making it easier to interpret patterns and identify meaningful insights.
By following these tips, you’ll unlock the full potential of OpenCRAVAT and simplify your variant analysis. Ready to dive in?
👉 Get started today:
🔗 Creating an OC account (web) https://docs.opencravat.org/en/latest/getting_started_web.html#creating-an-opencravat-account-web
🔗Convert your input file format https://docs.opencravat.org/en/latest/getting_started_web.html#convert-to-input-file-format
🔗Update Instructions https://docs.opencravat.org/en/latest/Update-Instructions.html#update-instructions
🔗Filter Your Results https://docs.opencravat.org/en/latest/getting_started_web.html#filter-results
🔗Visualize Your Results https://docs.opencravat.org/en/latest/getting_started_web.html#visualize-results
On the fourth day of OpenCRAVAT, we’re celebrating the power of trusted annotation sources! Annotation is at the heart of variant interpretation, and OpenCRAVAT integrates some of the most reliable and widely used databases to ensure your results are accurate and comprehensive.
Among the many sources available, four stand out for their unique contributions:
- gnomAD4 provides population frequency data, helping you distinguish between common and rare variants.
- dbSNP catalogs known single nucleotide polymorphisms and indels for quick reference.
- ClinVar offers clinical significance classifications, aiding in the identification of pathogenic variants.
- COSMIC focuses on cancer-related mutations, supporting oncological research and interpretation.
Together, these databases empower you to analyze variants with confidence and clarity. By leveraging the latest curated data, you can uncover insights that drive discovery and decision-making. Whether you’re focusing on rare genetic disorders, cancer genomics, or general research, OpenCRAVAT’s comprehensive annotation sources provide the foundation you need.
Explore these trusted sources today and see how OpenCRAVAT transforms your genomic data into meaningful insights!
👉 [Link to annotator list]


